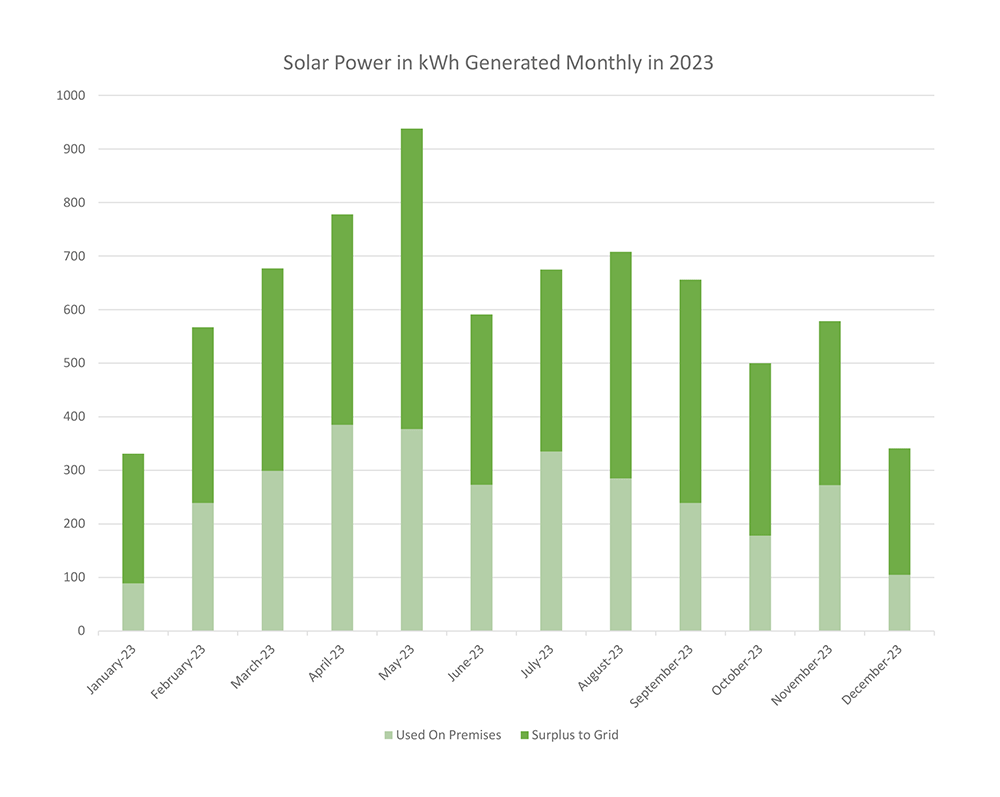
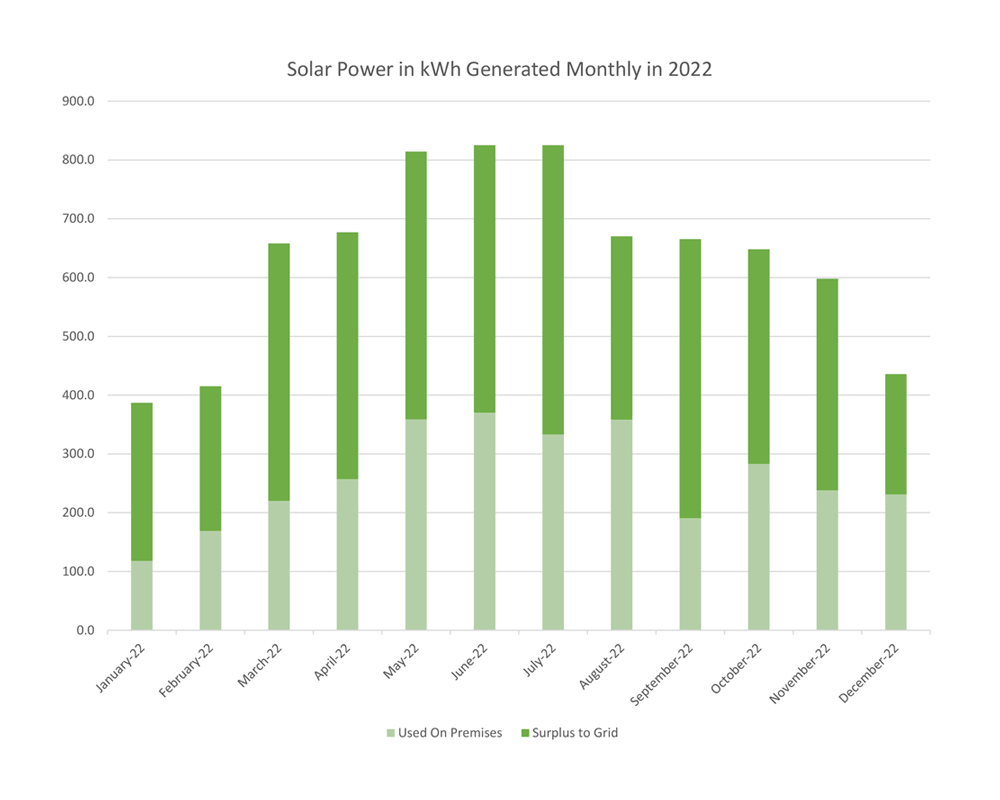
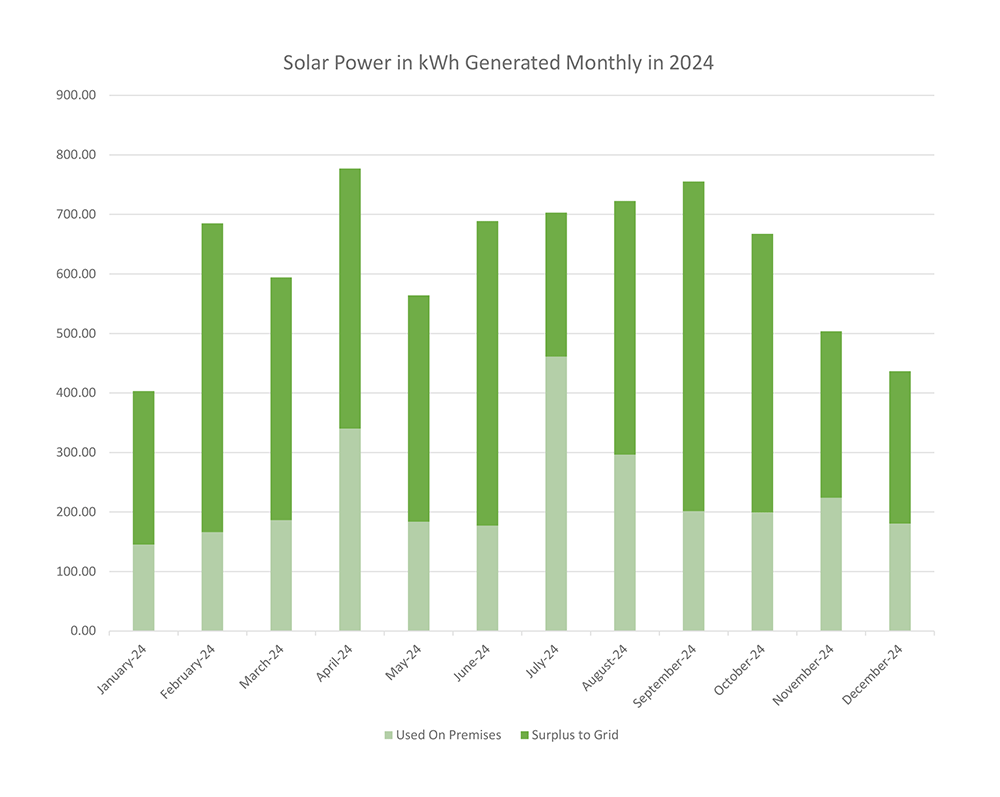
Solar Production in 2022

solar power generated in 2022

2022 was the fifth year for our rooftop solar system and at 7,569 kWh was the most productive year yet. That’s likely because we added a 4th string of panels to array #2 in October, raising our charging capacity from 6.4 to 7.4 kW. Definitely made a difference in those last 3 months of the year.

We used 3,126 kWh here and sent the excess 4,443 kWh to the grid, saving us a total of $1,240. Electricity costs rose sharply this fall but our existing contract with our supplier didn’t expire until November, but then it rose about 60%, so our rate of savings will increase this year. We’ve earned back $5,618 or 35% of the original investment.

Best month of production in 2022 was July, at 829 kWh, with May a close second. November produced a surprising 600 kWh, a combination of the additional panels plus a lot of sun.

We should see our biggest year yet in 2023 with the extra 1000 kW of charging power added by the new string.

Fourth Year Report

Solar Power in kWh Generated by Month in 2021

Year 4 is “in the can” as they say, let’s have a quick look to see how the solar system performed in 2021. We generated 7,619 kWh last year, 7% more than last year and the most productive year yet.

We used 3,126 kWh of that power on premises and exported the remaining 4,493 kWh surplus to the grid, slightly more than we exported the first year. That saved us $1,075, the largest savings in one year so far, bringing the lifetime savings to $4,362–which recoups 26% of the system cost.

June was the biggest production month last year at 755 kWh, with March and May close behind. As usual, December was the least productive month although this year it produced a respectable 399 kWh. November was surprisingly strong last year at 552 kWh.

The only maintenance issue that arose this year was the computerized control unit, known as the MATE3s, which had to be replaced after it stopped communicating consistently with the internet (which it does to send data to the cloud-based system monitor).

Third Year Results

Monthly Solar Production 2020

Hard to believe it’s been over three years since the system went online. Let’s have a quick look at the numbers for 2020. We cranked out 7,125 kWh last year, our best year yet and a 5% increase over 2019. The summer drought, which lasted until late September, probably had something to with that—definitely fewer gray days than normal.

We consumed 3,490 kWh on premises, a big jump from 2019 that can be attributed to the electric car we acquired last year. 3,635 kWh went to the grid, a significant drop from the previous two years again owing to charging the car battery. We saved $1,122.29 on electricity costs in 2020, bringing the lifetime cost savings to $3,306.46, or 20% of our investment. Depending on the price of electricity and other factors, we should recoup our investment around 2030.

Just like in 2019, May was the biggest month of production: 861.9 kWh. As usual, December brought the least production at 295.1 kWh. Interestingly, production was exceptionally high in October, matching June and just behind August. October can often bring gray skies and rain, especially later in the month, but not so much in 2020.

As in past years the system required almost no maintenance—just monitoring and occasional battery checks. Very pleased about that.

Looking forward to another great year in 2021.

Second Year Performance Review

Monthly Solar Production 2019

Time to run the numbers again: let’s check out the performance of our solar system during year two. In 2019 we produced 6,764 kWh of power, about 7% less than 2018. Spring and Fall were noticeably grayer in 2019, which likely accounts for the drop. We consumed 2,300 kWh of the power we generated on premises and fed the other 4,464 kWh of excess power production to the grid for others to use.

At the 2019 utility rate of 15.33 cents per kWh, we saved $1,036.92 on our utility bills in 2019. Combine that with 2018 savings and after two years we’ve recouped 14% of our investment.  At the current rate in 12 more years we’ll have saved as much as we spent on the system. But of course the utility rates will rise during that time so we’re probably looking at 10 years or possibly less, depending on the rates.

July was the biggest month in terms of power generated in 2019, compared to May in 2019 (as I said earlier, gray wet spring). March was also a big month last year, which makes sense given the bare trees (one of our strings is partially shaded by oak trees in the morning) and the cold weather, which noticeably boosts panel efficiency. March is also the month when the sun’s angle is optimal for our 45 degree panel orientation.

So far, so good. Here’s to a sunny spring this year.

Copyright ©2018 Sunny Power. All rights reserved.