Third Year Results

Monthly Solar Production 2020

Hard to believe it’s been over three years since the system went online. Let’s have a quick look at the numbers for 2020. We cranked out 7,125 kWh last year, our best year yet and a 5% increase over 2019. The summer drought, which lasted until late September, probably had something to with that—definitely fewer gray days than normal.

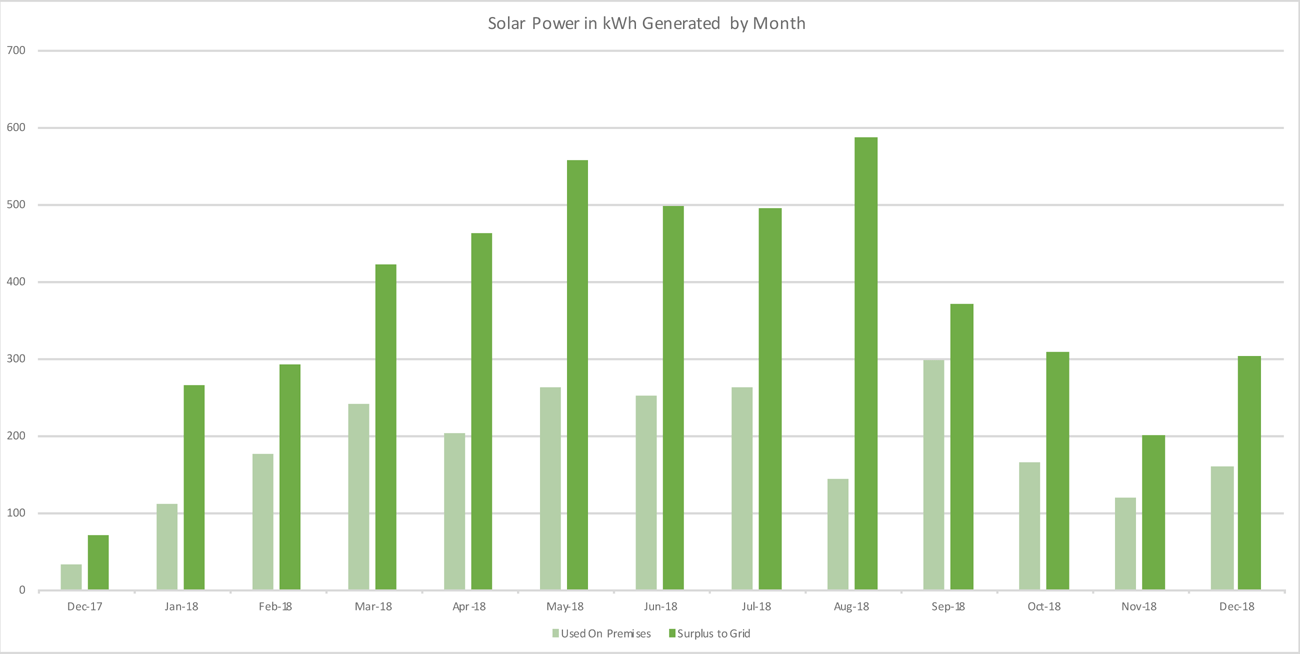
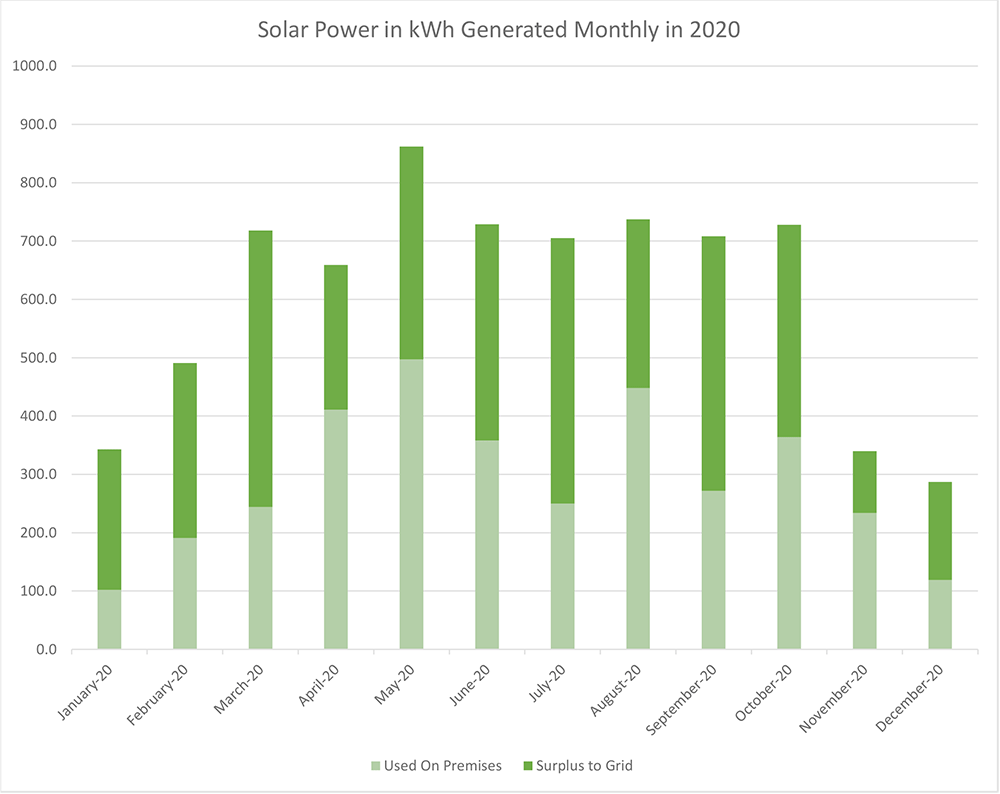
We consumed 3,490 kWh on premises, a big jump from 2019 that can be attributed to the electric car we acquired last year. 3,635 kWh went to the grid, a significant drop from the previous two years again owing to charging the car battery. We saved $1,122.29 on electricity costs in 2020, bringing the lifetime cost savings to $3,306.46, or 20% of our investment. Depending on the price of electricity and other factors, we should recoup our investment around 2030.

Just like in 2019, May was the biggest month of production: 861.9 kWh. As usual, December brought the least production at 295.1 kWh. Interestingly, production was exceptionally high in October, matching June and just behind August. October can often bring gray skies and rain, especially later in the month, but not so much in 2020.

As in past years the system required almost no maintenance—just monitoring and occasional battery checks. Very pleased about that.

Looking forward to another great year in 2021.

First Year – Results

solar power generation by month 2018

It’s now been a full year since we installed solar at the house–time to look at the numbers and see how things went in terms of production and return on investment. While planning back in the summer and fall of 2017, we calculated our estimated production using the PV Watts calculator at the National Renewable Energy Lab. Turns out it was pretty accurate on the whole: 7,705 kWh for the  year, versus actual production of 7,250 kWh.

We used 2,418 kWh of that power ourselves, offsetting power we otherwise would’ve had to buy, and pushed 4,832 kWh onto the grid for other people to use. At the current rate of 15.59 cents per kWh, that saved us $1,139.26 in 2018, a return of 7% of our investment. In short, the system performed very much as expected.

It was interesting to see the variability in power production month to month. May was the biggest month overall, but we had an usually dry and sunny May here. One surprise was that December ended up being a bigger month than November, January, and February, which is surprising given the short days and low sun angle. But we had a lot of sunny days in December, and the cold temperatures help the panels work efficiency.

Here’s to an even better year in 2019!

Six Months In: Results so Far

net metering

Last month marked the half year point since our solar system went online, so I thought I’d take a moment to share some numbers and report on how things have gone in general. All in all, we couldn’t be happier–the only significant issue is that our utility company, Central Maine Power, is going through a complete billing system meltdown. Let’s just say I’m glad I keep careful records of our power usage, because they sure don’t! Continue reading “Six Months In: Results so Far”

Copyright ©2018 Sunny Power. All rights reserved.