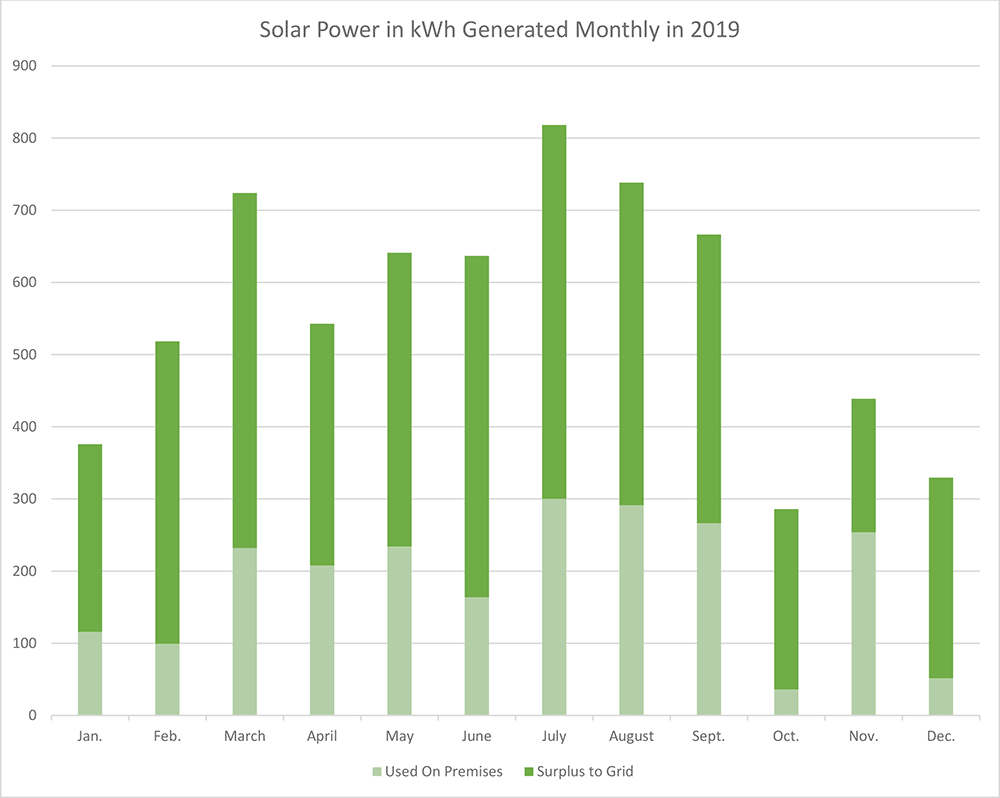
Time to run the numbers again: let’s check out the performance of our solar system during year two. In 2019 we produced 6,764 kWh of power, about 7% less than 2018. Spring and Fall were noticeably grayer in 2019, which likely accounts for the drop. We consumed 2,300 kWh of the power we generated on premises and fed the other 4,464 kWh of excess power production to the grid for others to use.
At the 2019 utility rate of 15.33 cents per kWh, we saved $1,036.92 on our utility bills in 2019. Combine that with 2018 savings and after two years we’ve recouped 14% of our investment. At the current rate in 12 more years we’ll have saved as much as we spent on the system. But of course the utility rates will rise during that time so we’re probably looking at 10 years or possibly less, depending on the rates.
July was the biggest month in terms of power generated in 2019, compared to May in 2019 (as I said earlier, gray wet spring). March was also a big month last year, which makes sense given the bare trees (one of our strings is partially shaded by oak trees in the morning) and the cold weather, which noticeably boosts panel efficiency. March is also the month when the sun’s angle is optimal for our 45 degree panel orientation.
So far, so good. Here’s to a sunny spring this year.